The purpose of this project is to carry out an analysis of solar extinction data in order to derive information about atmospheric aerosol.

The purpose of this project is to carry out an analysis of solar extinction data in order to derive information about atmospheric aerosol. |
 |
Plot the 1984 and 1987 Mauna Loa data on separate Langley diagrams and determine the slopes and intercepts of the curves.
Using the subroutine pmrayl.f, determine the aerosol optical depth at three specified wavelengths (380, 500, and 778nm).
Calculate the wavelength exponent (alpha) for the two periods and discuss any inferences you may make about the relative size of the aerosol measured, bearing in mind the time of the El Chichón eruption. You will note that this value of alpha depends on which particular pair of wavelengths you choose. Can you give physical account for why this is the case?
The FORTRAN subroutine pmrayl.f calculates Rayleigh and Ozone optical depths for the three wavelengths specified above. In order to compute the Rayleigh optical depth, a surface pressure must be specified. Assume for this purpose the climatological value of surface pressure given in the subroutine.
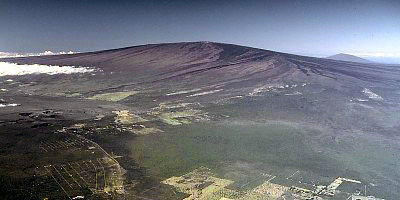
The latter two files contain direct beam solar radiation measurements at 380, 500, and 778 nm for January 1984 and January 1987. The location of these measurements is Mauna Loa, Lat/Lon = (19.533N, 155.578W) at an elevation of 3400 m. A sample of the data from file mlo78Jan.84 is:
| Year | Day | Time | V1 | V2 | V3 | Air Mass |
|---|
| 84 | 7 | 17.9333 | 2.988 | 3.190 | 6.396 | 4.9435 |
| 84 | 7 | 17.9500 | 3.071 | 5.254 | 6.423 | 4.8611 |
| 84 | 7 | 17.9667 | 3.157 | 5.315 | 6.453 | 4.7808 |
| 84 | 7 | 17.9833 | 3.235 | 5.361 | 6.465 | 4.7037 |